R 기초 209 데이터 재구성하기 (Reshaping Data)
preface 이번 포스트에서는 데이터를 재구성하여 구조를 바꾸는 방법에 대하여 설명합니다.
다음 자료를 참고하였습니다:
R 은 실제 분석에 들어가기 전에 데이터를 재구성하여 구조를 바꾸는 다양한 방법을 제공합니다.
Transpose
t( ) 함수를 이용하면 matrix 나 data frame 을 transpose 할 수 있습니다. data frame 의 경우, rownames 가 변수명(column names)이 됩니다.
# example using built-in dataset
 mtcars
 t(mtcars)
reshape 패키지 이용하기 (The Reshape Package)
Hadley Wickham 이 만든 reshape 패키지는 매우 강력합니다. 소개글 과 논문, 비디오까지 있습니다.
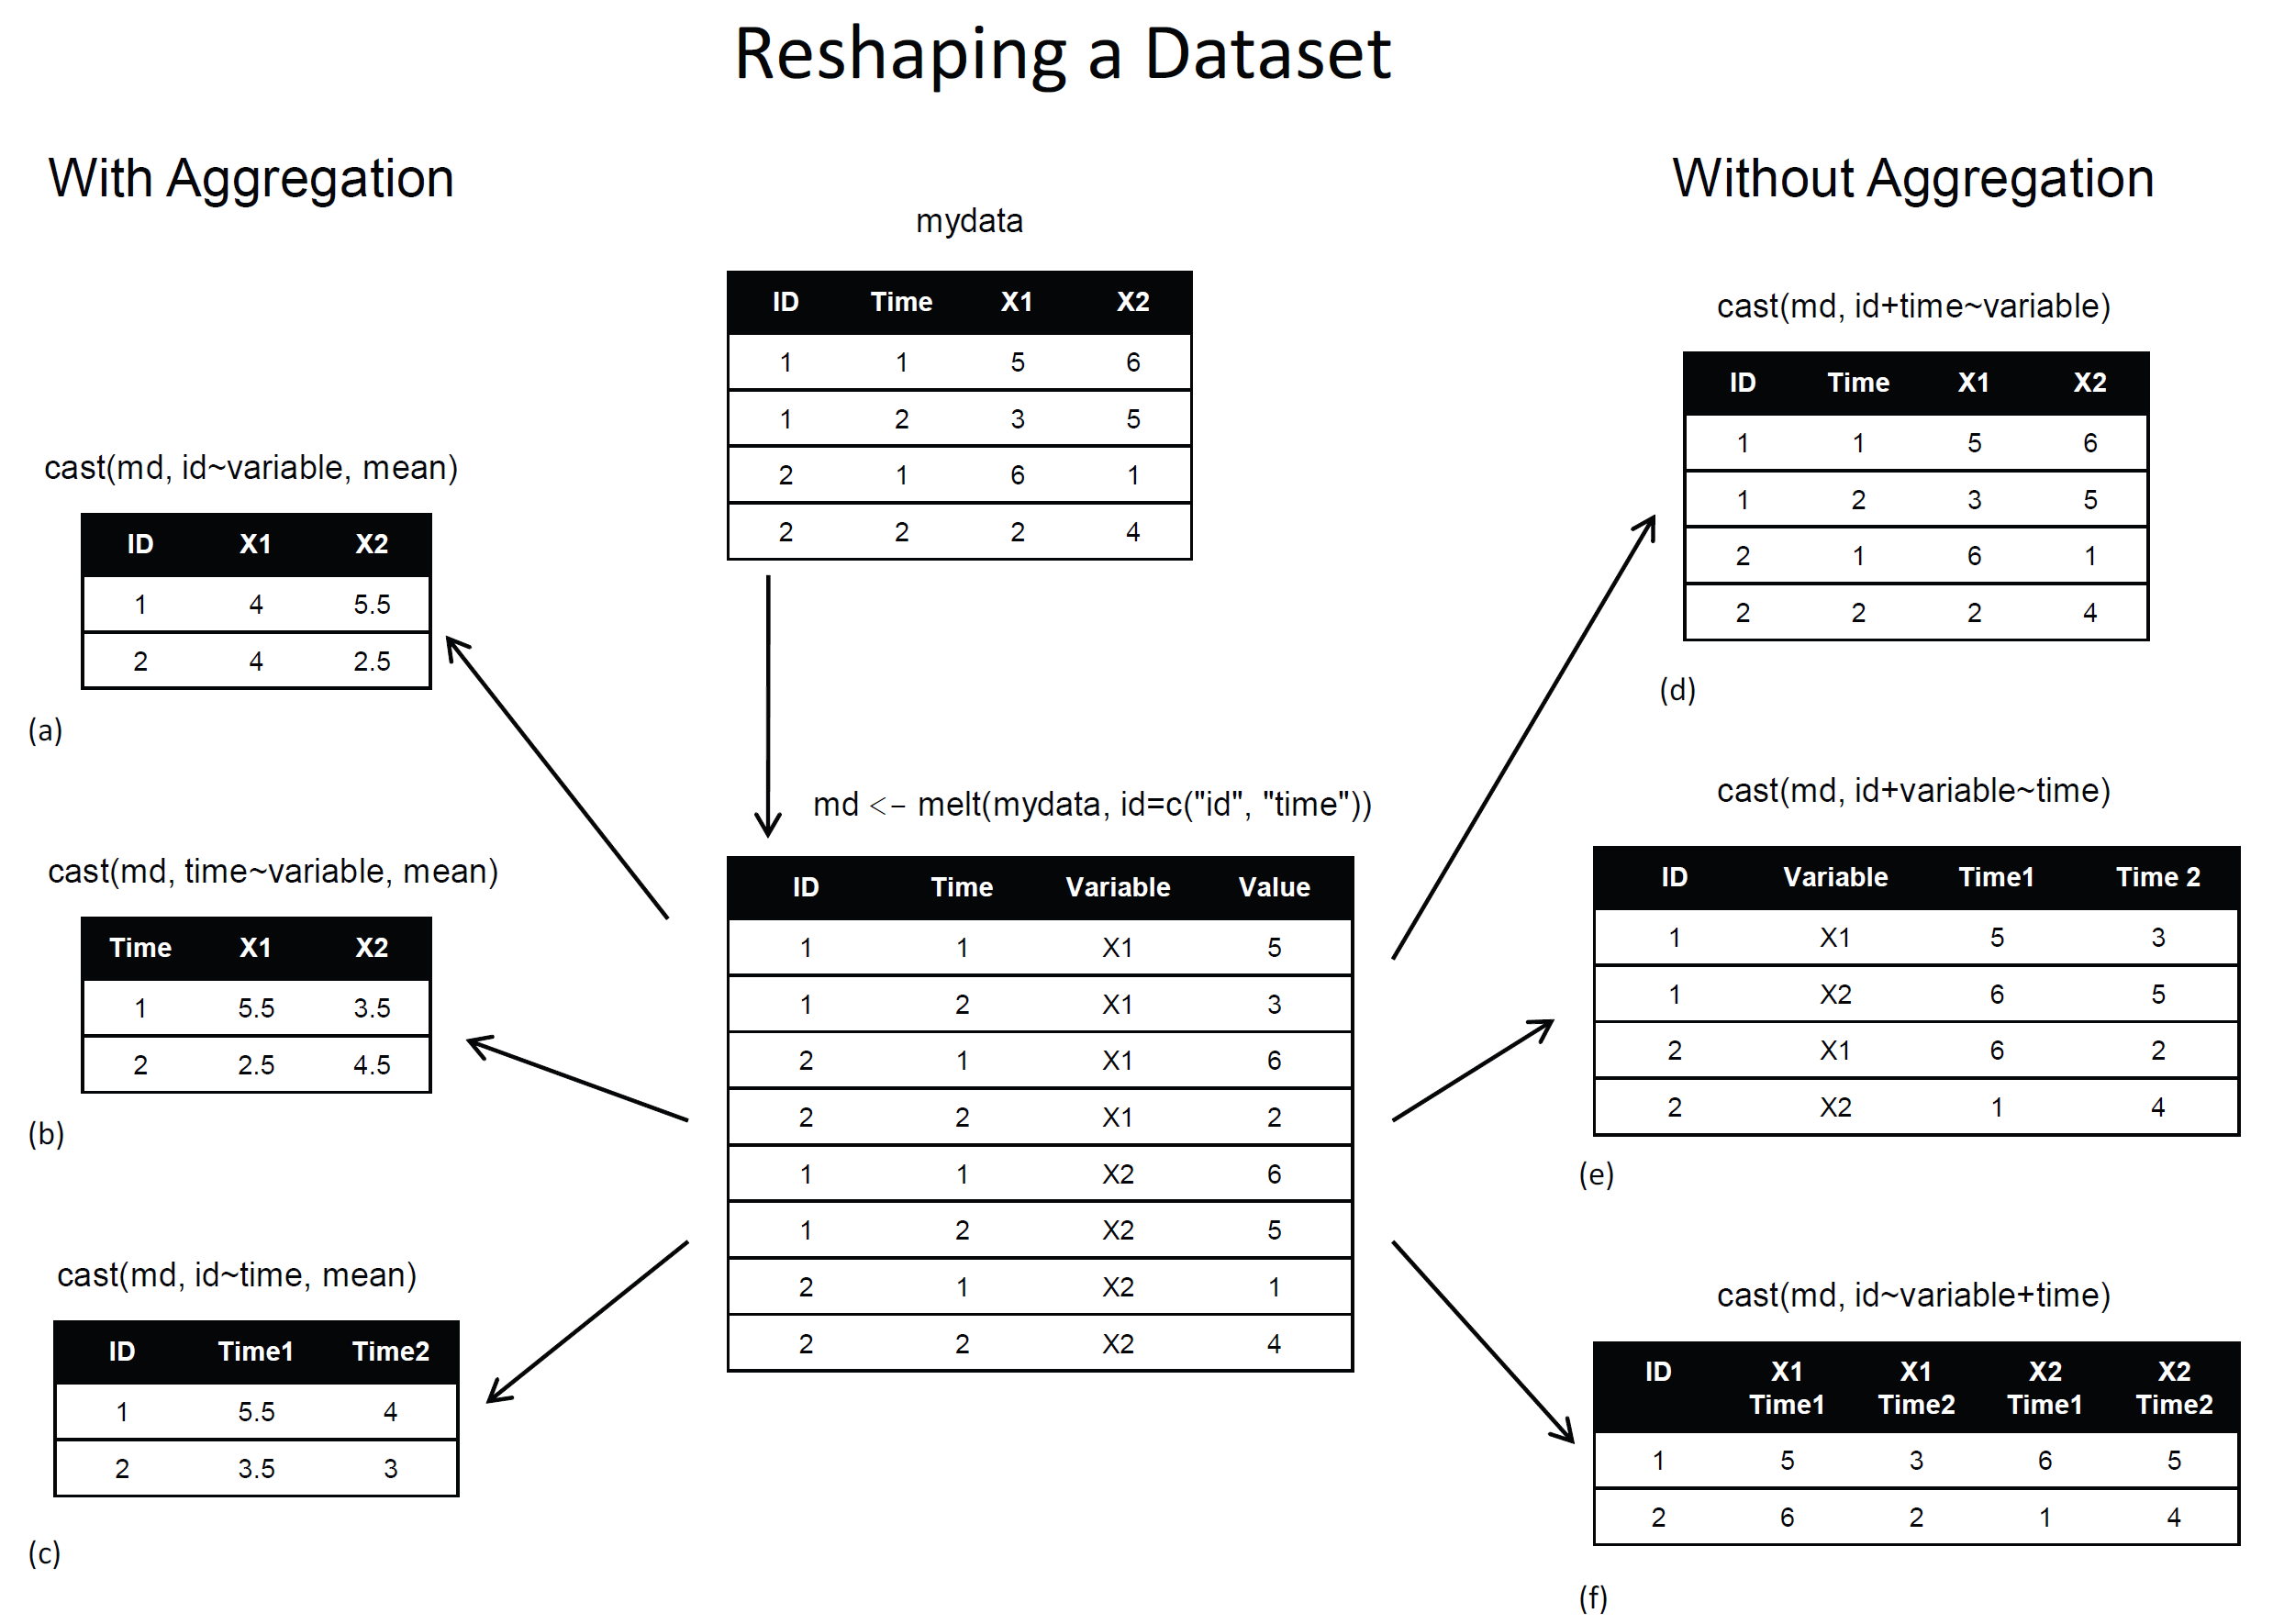
melt( ) 함수를 사용하면 각 관측치가 unique 한 id-variable 을 가지는 panel data 형태로 만들어줍니다. cast( ) 함수를 사용하면 이렇게 melt 된 데이터를 원하는대로 조합할 수 있습니다. 아래 그림과 예제를 참고하시기 바랍니다.
[그림: reshape 패키지 사용 개념도] (자료: r-statistics.com)
mydata
| id | time | x1 | x2 |
|---|---|---|---|
| 1 | 1 | 5 | 6 |
| 1 | 2 | 3 | 5 |
| 2 | 1 | 6 | 1 |
| 2 | 2 | 2 | 4 |
melt( )
# example of melt function
library(reshape)
mdata <- melt(mydata, id=c("id","time"))
newdata
| id | time | variable | value |
|---|---|---|---|
| 1 | 1 | x1 | 5 |
| 1 | 2 | x1 | 3 |
| 2 | 1 | x1 | 6 |
| 2 | 2 | x1 | 2 |
| 1 | 1 | x2 | 6 |
| 1 | 2 | x2 | 5 |
| 2 | 1 | x2 | 1 |
| 2 | 2 | x2 | 4 |
cast( )
# cast the melted data
# cast(data, formula, function)
subjmeans <- cast(mdata, id~variable, mean)
timemeans <- cast(mdata, time~variable, mean)
subjmeans
| id | x1 | x2 |
|---|---|---|
| 1 | 4 | 5.5 |
| 2 | 4 | 2.5 |
timemeans
| time | x1 | x2 |
|---|---|---|
| 1 | 5.5 | 3.5 |
| 2 | 2.5 | 4.5 |
Tag Cloud
R SQL classification demension reduction jekyll python regression supervised
Hyeongjun Kim
Financial Economist, Data Scientist, and Hearthstone Player